ایمیل
ایمیل  چت آنلاین
  پشتیبانی
 آموزش کار با Bandwidth در cpanel

دوستان عزیز پیشگام وبی امیدوارم که حالتون خوب باشه ، امروز با آموزش کار با Bandwidth در cpanel خدمتتون هستیم و امیدوارم توضیحاتی که در این مطلب و یا در انتها مطلب که بصورت فیلم قرارداده شده بتونه به شما کمک کنه و هر روز بیشتر پیشرفت کنید.
خوب اصلا این قسمت به چه دردی میخوره کجا بهش نیاز داریم و در کل کاربردش چی هست؟
در هنگام خرید یک هاست ، مواردی برای استفاده از آن مهم است که باید به آن دقت ویژهای داشت ، به طور مثال فضای اختصاص یافته به هاست شما ، تعداد دامنه قابل پارک و مواردی دیگر که این موضوع شامل پهنای باند نیز میگردد.
پهنای باند در واقع همان مقدار مصرف شما از دادههای هاستتان است. به طور کلی هرگونه ارسال و دریافت اطلاعات از هاست شما که اعم از دیدن وب سایت ، ارسال و دریافت ایمیل ، ارسال و دریافت فایل از طریق FTP و … میشود ، پهنای باند یا همان Bandwidth گفته میشود.
به طور مثال اگر صفحه اصلی وب سایت شما حجمی معادل 30 کلیوبایت داشته باشد و در روز 1000 نفر صفحه اصلی وب سایت شما را بازدید کنند ، 30000 کیلوبایت از پهنای باند شما مصرف خواهد شد.
امروزه سرویسدهندگان هاست به شکلی یک پلن میزبانی وب را ارائه میدهند که پهنای باند مناسبی برای شما در نظر میشود اما اگر شما مصرف زیادی را در بخشهای دیگر داشته باشید و یا از حد تعریف شده بیشتر مصرف کنید با کمبود پهنای باند مواجه خواهید شد.
این قسمت برای محدودیت در فایل هایی که از سایت ما لود میشوند در سی پنل میباشد که با عنوان Bandwidth در قسمت Metrics موجود در داخل کنترل پنل محبوب سی پنل ( capnel ) میباشد.
ابتدا وارد هاستمون داخل سایت پیشگام وب میشیم.
میتوانید از سایت پیشگام وب قسمت سرویس های من ، سرویس مورد نظر را انتخاب کرده و ورود به سی پنل را بزنید تا بصورت اتوماتیک وارد هاستتون بشید و همچنین میتوانید از لینک سایت خودتون ، البته اگر که دی ان اس های ( DNS ) پیشگام وب را درست ست کرده باشید و 24 ساعت گذشته باشد از طریق پورت 2082 و یا 2083 وارد بشید.
فقط نکته ای که هست و باید بهش توجه کنید ، اگر سایت را با http باز میکنید از پورت 2082 و اگر با https باز میکنید از 2083 استفاده کنید ، نمونه لینک در زیر مشخص شده است.
البته به این نکته توجه داشته باشید که باید جای آدرس سایت ما آدرس سایت خودتان را وارد کنید.
راه آخر جهت لاگین هم در صورتی که دی ان اس ها ( DNS ) را ست نکرده اید یا 24 ساعت از تنظیم آنها نگذشته است و دوست ندارید بطور مثال اطلاعات ناحیه کاربری رو به طراح بدید استفاده از لینک پیشفرض پیشگام وب هست که در زمان خرید هاست برای شما ارسال شده و اگر هم نتونستید پیدا کنید میتوانید تیکت بدهید تا به شما داده شود ، پایین هم میتوانید نمونه لینک رو مشاهده کنید.
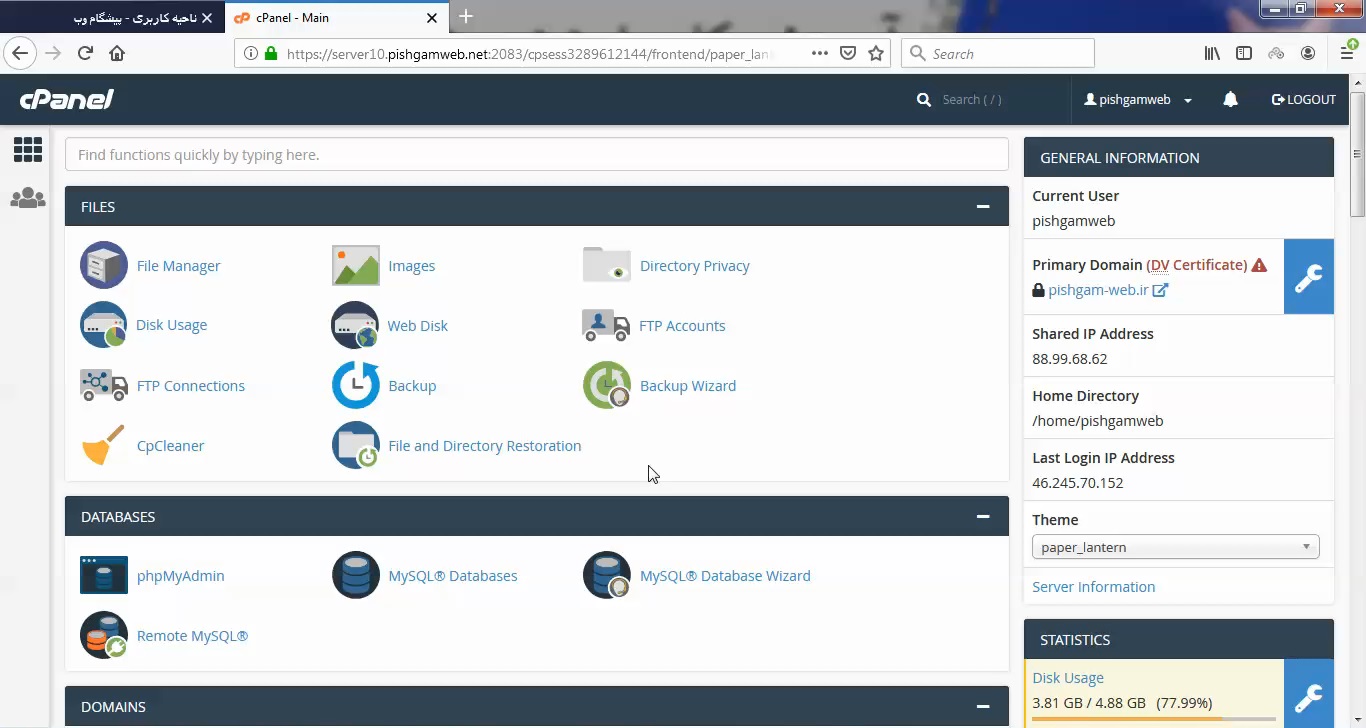
بعد از ورود به هاستمون یا همون سی پنل با صحه زیر روبرو میشیم .
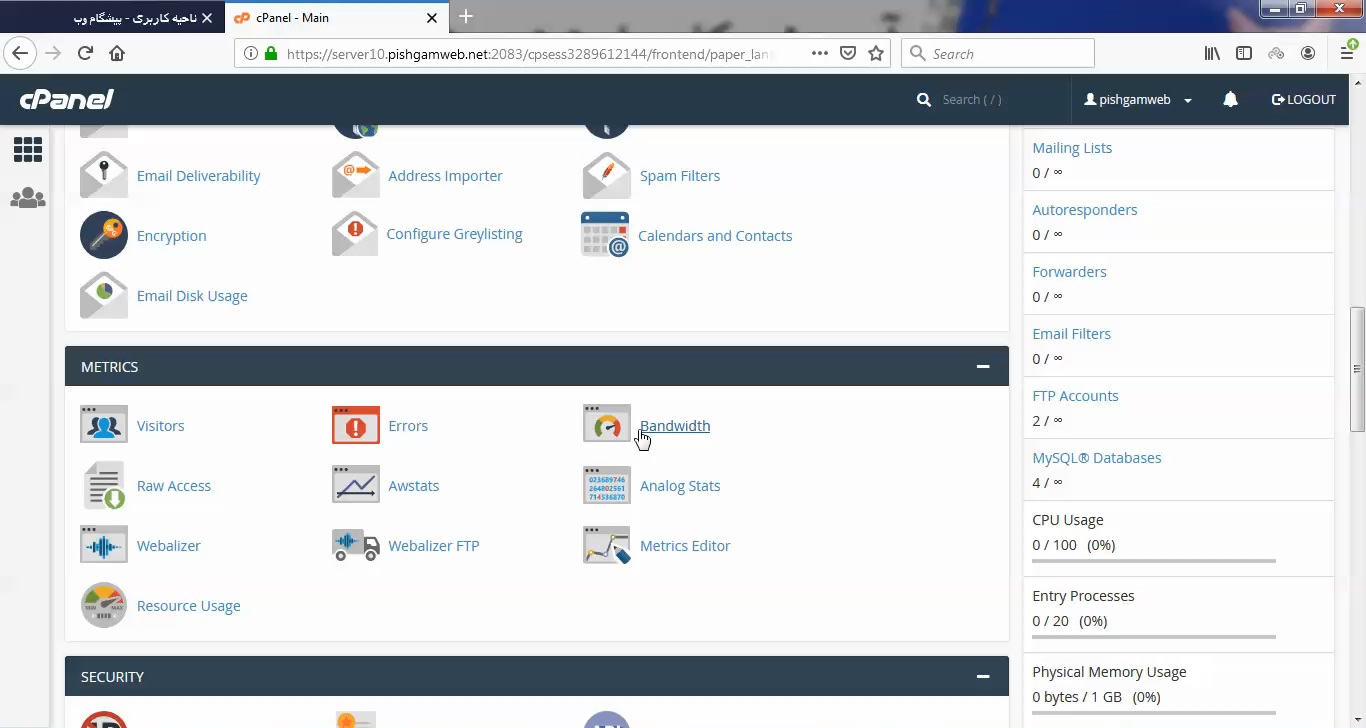
از قسمت عنوان ها Metrics را پیدا میکنیم و روی گزینه Bandwidth کلیک میکنیم.
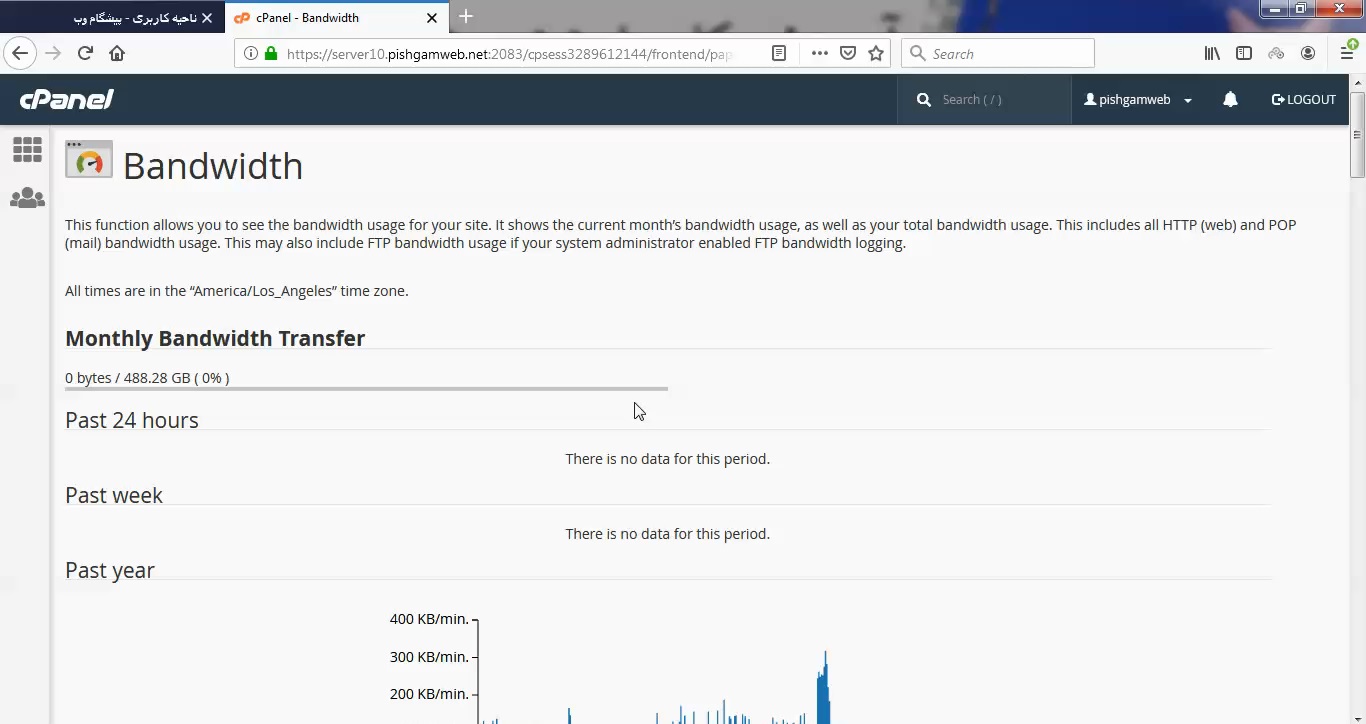
بعد ورود به این قسمت همونطور که در تصویر زیر مشخص هست میتوانید پهنای باند مصرفی را بر اساس ساعت ، روز ، هفته و ماه مشاهده کنیم.
همانطور که مشاهده میکنید در این قسمت اطلاعات مربوط به ماه های گذشته میلادی را مشاهده میکنید.
در نظر داشته باشید که به طور کلی سیپنل پنج سرویس و پروتکل پرمصرف FTP ، SMTP ، IMAP ، HTTP و POP3 را به صورت پیشفرض نمایش میدهد ، چنانچه قصد دارید تمامی سرویسها را بررسی نمایید بر روی گزینه Total زیر هر ماه کلیک کرده تا تمامی سرویسها برای شما نمایان شوند.
HTTP – ترافیک وب
POP3 – ایمیل هایی که حساب های شما دریافت کرده اند.
IMAP – ایمیل هایی که حساب های شما دریافت کرده اند.
FTP – انتقال پرونده از طریق برنامه های ftp
SMTP – ایمیل هایی که حساب های شما ارسال نموده اند.
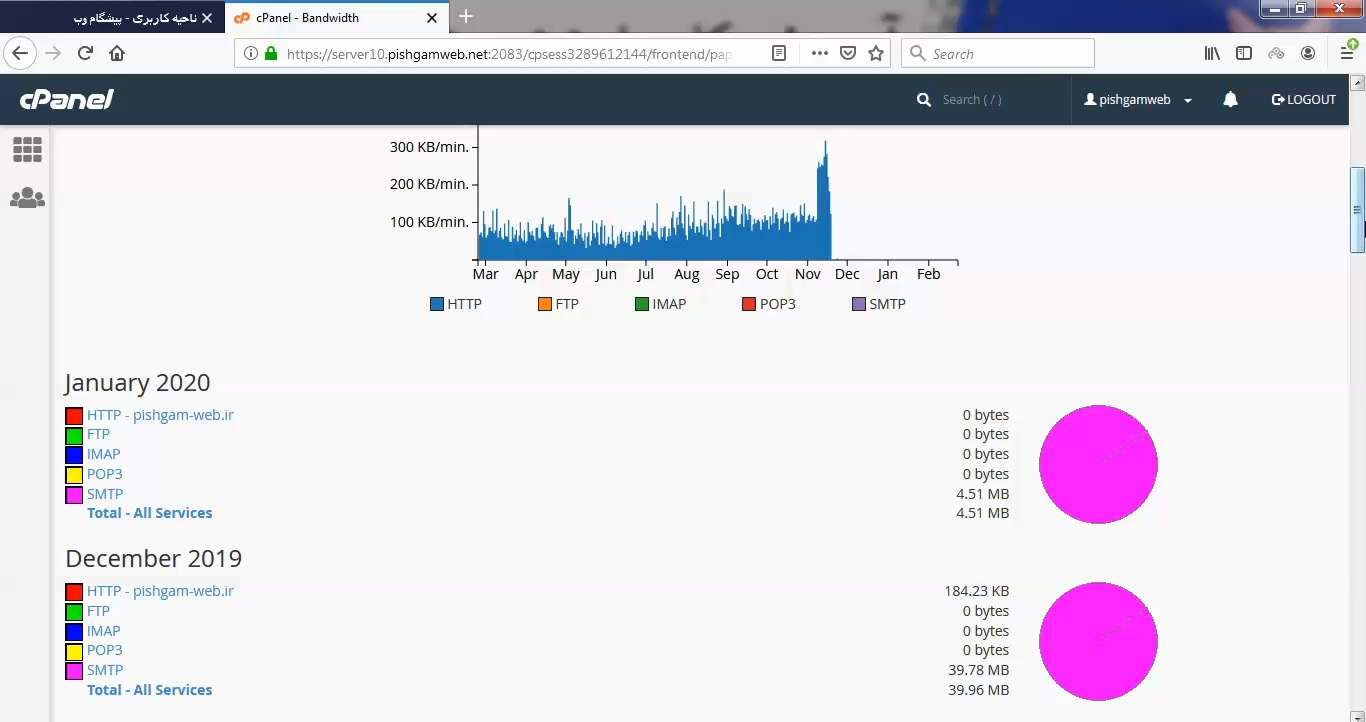
در عکس زیر ما یکی از ماه های میلادی رو انتخاب کردیم و همونطور که مشاهده میکنیم بر اساس روز های ماه میلادی میتوانید مصرف پهنای باند سایتتون را مشاهده کنید.
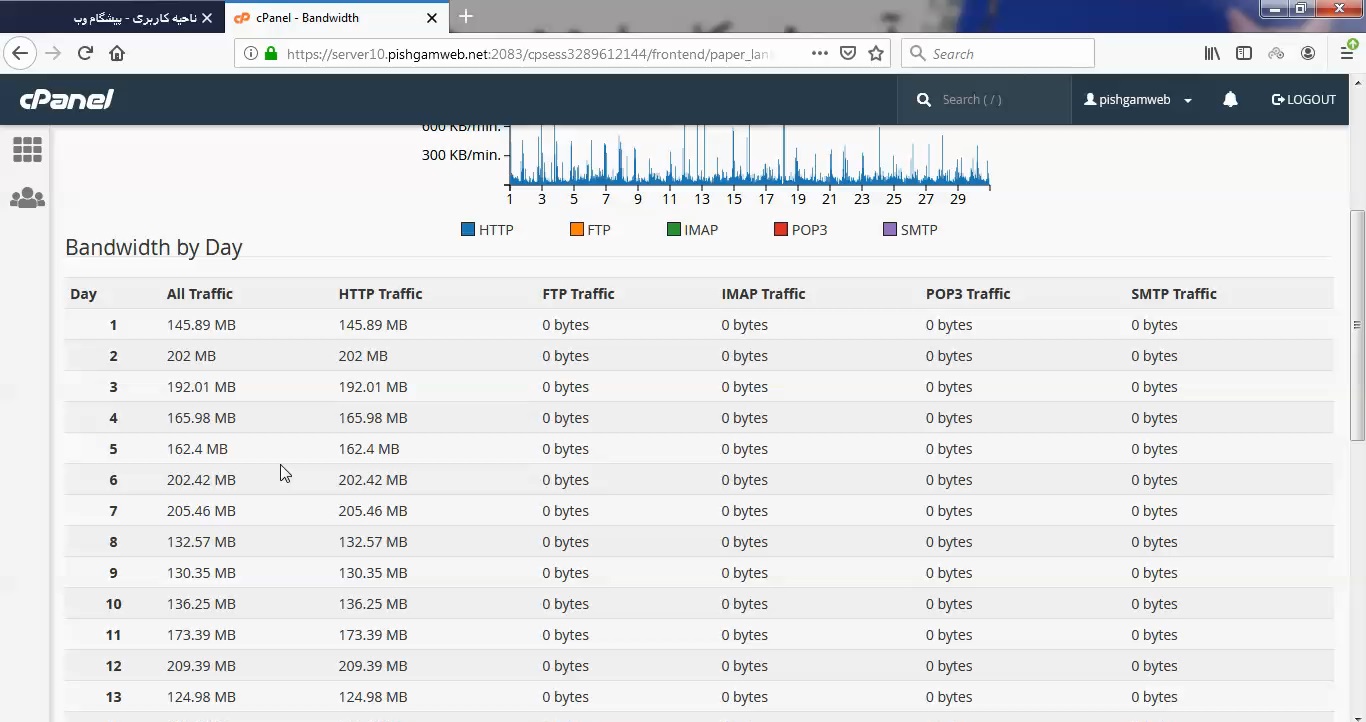
همونطور که در این گزارش مشاهده میکنید بیشتر مصرف تقریبا 99 درصد آن مربوط به http هست و مقدار کمی مربوط به یکی از ساب دومین ها و ایمیل میباشد.
آموزش کار با Bandwidth در دایرکت ادمین
پس از ورود به صفحه دایرکت ادمین همان طور که در تصویر مشخص شده است می توانید میزان پهنای باند (“Bandwidth”) و میزان فصای مصرفی (“Disk Space”) را به صورت کلی مشاهده نمائید.
جهت مشاهده جزئیات پهنای باند و فضای مصرفی بر روی گزینه “Site Summary / Statistics / Logs” کلیک نمائید.
در صفحه جدید جهت مشاهده جزئیات پهنای باند بر روی گزینه “Details” کلیک نمائید.
در این صفحه می توانید جزئیات میزان مصرف پهنای باند توسط سرویس هایی مانند FTP ، Email، POP و … را در بازه های زمانی ملاحظه نمائید.
جهت مشاهده جزئیات فضای مصرفی بر روی گزینه “Details” کلیک نمائید.
در صفحه جدید می توانید جزئیات میزان مصرف فضای میزبانی را ملاحظه نمائید.
مشاهده فیلم آموزشی از سایت آپارات
برای دانلود فیلم آموزش از قسمت تنظیمات روی گزینه دانلود کلیک کرده و کیفیت مد نظر خود را انتخاب کنید تا فیلم آموزش دانلود گردد.
نکته : هر چقدر که عدد این قسمت بیشتر باشد ، کیفیت فیلم دانلودی بالاتر خواهد بود.
آموزش های متوسطه :
دوستان عزیز آموزش که خدمتتون ارائه کردیم از سری آموزش های ابتدایی پیشگام وب هست و این آموزش جزو آموزش های متوسطه هست که باعث میشه شما بتونید سایتتون رو بهتر از قبل مدیریت کنید.
این آموزش ها به شما کمک میکنه تا به مرور زمان به یک طراح سایت تبدیل بشید و اون رو به عنوان شغل خودتون انتخاب کنید و اگر هم قصد ندارید به عنوان شغل بهش نگاه کنید میتوانید پشتیبانی سایت خودتان را در دست بگیرید
learn from cpanel
Time zone
The interface displays the server’s time zone setting as follows:
All times are in the "America/Chicago" time zoneIf the system detects that your browser’s time zone does not match the server’s time zone, the interface will contain a notice that resembles the following:
Set the time to "America/Chicago" time zone and reload.Click the link to reset the time zone and reload the interface.
Past 24 hours
The Past 24 hours graph displays the data transfer rate in bits per second for the current day, averaged into five minute intervals.
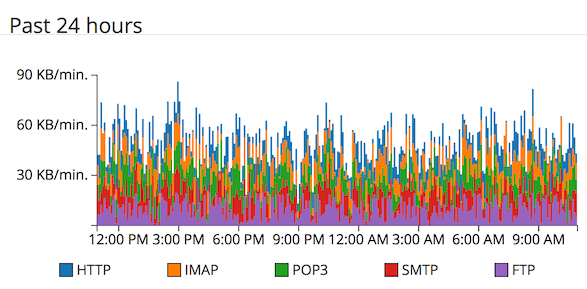
By default, this graph updates every two hours. However, if your hosting provider adjusts the bandwidth data process interval in WHM’s Statistics Software Configuration interface (WHM >> Home >> Server Configuration >> Statistics Software Configuration), this affects the amount of bandwidth data that the system displays.
Use this graph to view the following information:
- Small-scale trends (for example, quick spikes in traffic at specific times).
- Changes over the course of the day (for example, increases and decreases in traffic).
Past week
The Past week graph displays the data transfer rate, in bits per second, over the past seven days, averaged into five-minute intervals.
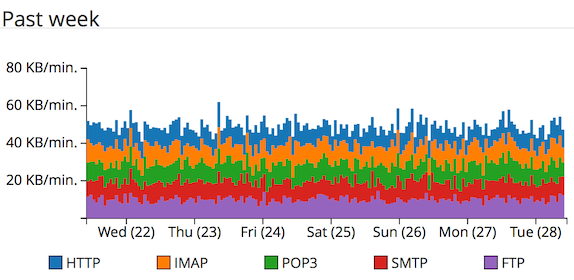
A sample Past week graph.
Use this graph to view the following information:
- Larger-scale trends (for example, spikes in traffic at the same time each day for the past three days).
- Changes from the past week (for example, increases or decreases in traffic over a period of two to seven days).
Past year
The Past year graph displays the total amount of data that the system transferred over a period of 12 months (one year).
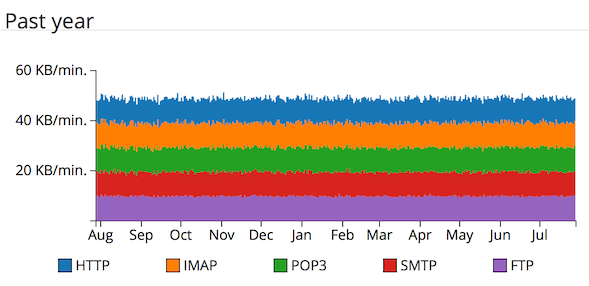
Use this graph to find long-term trends over an entire year. For example, this graph might indicate that your account receives a heavy burst of traffic at mid-month every month.
Monthly pie charts
The monthly pie charts display the relative amounts of data that your cPanel account’s various services and domains use in each month.
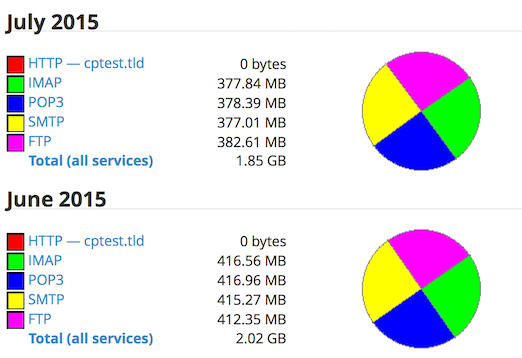
A sample pie chart
Use the pie charts to view the following information:
- The total amount of data that the system transferred for the month.
- Changes in the relationships between services from month to month. For example, SMTP total bandwidth increased from 5% to 50% in one month, while HTTP bandwidth decreased.
- Changes in the bandwidth usage of one domain relative to another domain. For example, the domain
example1.comaccounts for 50% of the overall traffic of all sites, andexample2.comaccounts for about 25%.
To view the Bandwidth Transfer Detail interface for a month, click that month’s pie chart. Note:
Click a usage link for a month to look up the usage information for an individual website or service. A new interface will display detailed monthly traffic information for that particular service or website.
The Bandwidth Transfer Detail interface
To view the bandwidth transfer information for a particular month, click Total (all services) for that month.
This interface contains a series of bandwidth usage graphs for the following types of traffic:
- HTTP
- SMTP
- FTP
- POP3
- IMAP
All Traffic (monthly)
The All Traffic monthly graph displays the hourly average bytes that the system transferred for the month. It provides a detailed version of the data that the Past year graph displays.
Use this graph to find trends over a period of several days or weeks. For example, this graph might indicate that your account receives heavier traffic on a specific day of the month.
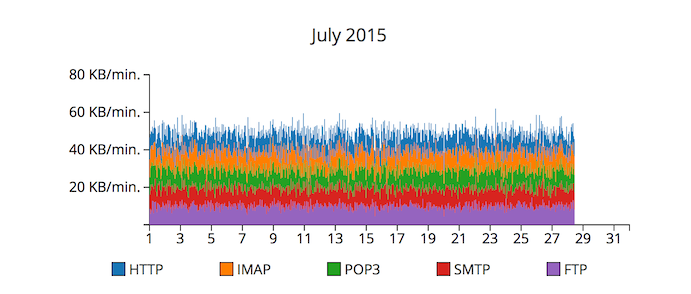
Monthly traffic graphs for services
The monthly traffic graphs serve the same purpose as the All Traffic graph, but the system separates the data for individual services.
All Traffic (daily)
The All Traffic daily graph displays 30-minute averages of bits that the system transferred per second. It is a more detailed version of the All Traffic monthly graph.
Daily traffic graphs by service
Under the All Traffic graph is a series of one or more bar graphs for specific services. These serve the same purpose as the All Traffic graph, but the system separates the data for individual services.
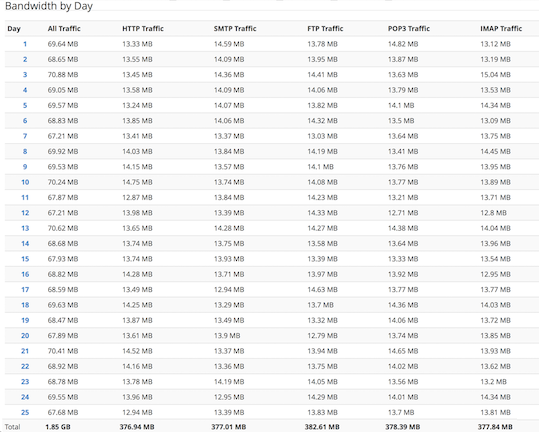
Bandwidth By Day
The Bandwidth by Day table lists the total amount of the cPanel account’s data that the system transferred on a specific day of the month, in megabytes (MB).
Click a day in the table to view more information about that day’s traffic.
Note:
We recommend that you view the Bandwidth by Day table at least 24-48 hours after the last day of the period for which you wish to obtain data. This allows the system to gather and process the traffic data.
Non-recorded bandwidth information
The Bandwidth displays information about your website, rather than about your cPanel & WHM server. As a result, the system does not count the following processes towards your bandwidth usage or allotment:
- Protocols such as file manager uploads and downloads.
- Incoming mail that other servers deliver.
- POP/IMAP bytes received for tasks such as polling for new email.
- SMTP (received) mail.
- DNS activity.
- Any user processes spawned by cron jobs that perform network activity.
You systems administrator can monitor your cPanel & WHM server’s bandwidth via the Munin plugin, which they can download in WHM’s Manage Plugins interface (WHM >> Home >> cPanel >> Manage Plugins).